Case study · Product/UX Design · 2022–2023
Reimbursement Intelligence
An AI and Machine Learning solution embedded in SulAmérica's ecosystem to detect, analyse and prevent health reimbursement fraud in real time.
- Client
- Neurotech | Trillia [B3] · SulAmérica
- Role
- UX/Product Designer
- Timeline
- 1 year
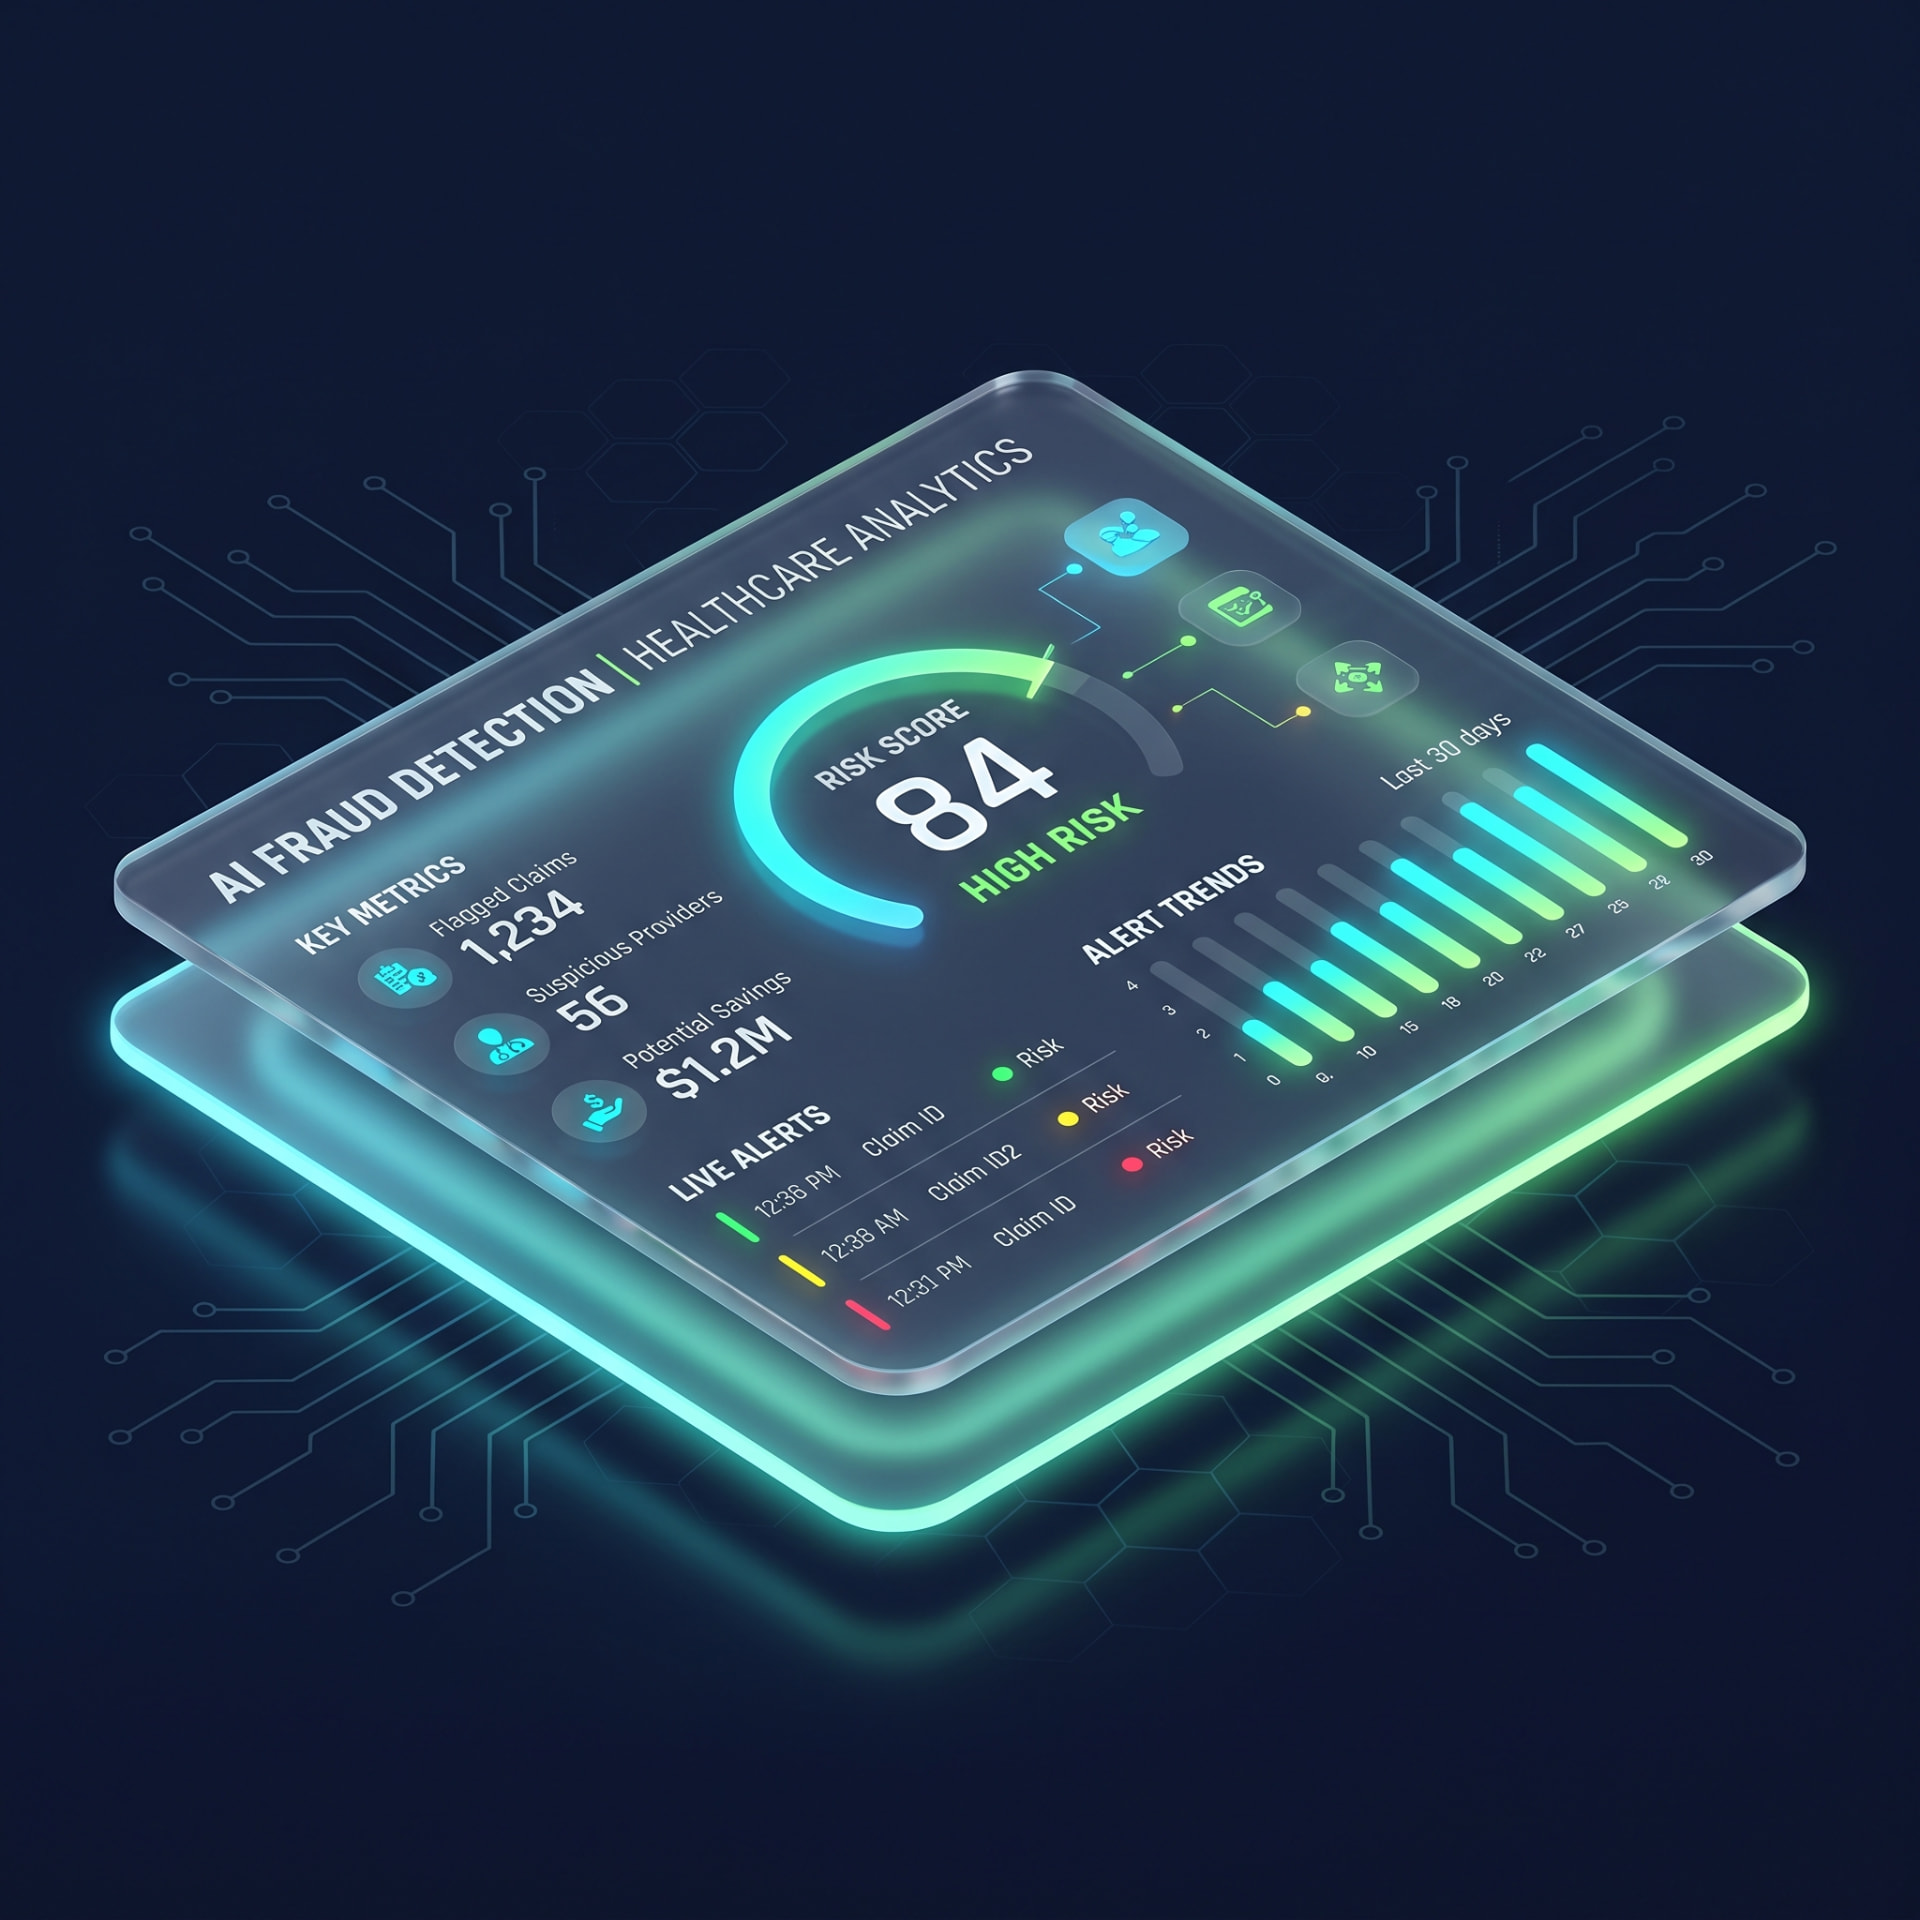
R$ 30M
in direct savings within 6 months in production
6 months
until results showed up in production
↓ False+
sharp reduction in false alarms during triage
- 01
Context and challenge
Fraud and irregular reimbursement claims create massive financial risk for insurers. We mapped the current ecosystem (as-is) and designed an optimised future flow (to-be) to orchestrate automated fraud detection end to end.
- Current journey map
- Future journey map
- Success criteria agreed with the client
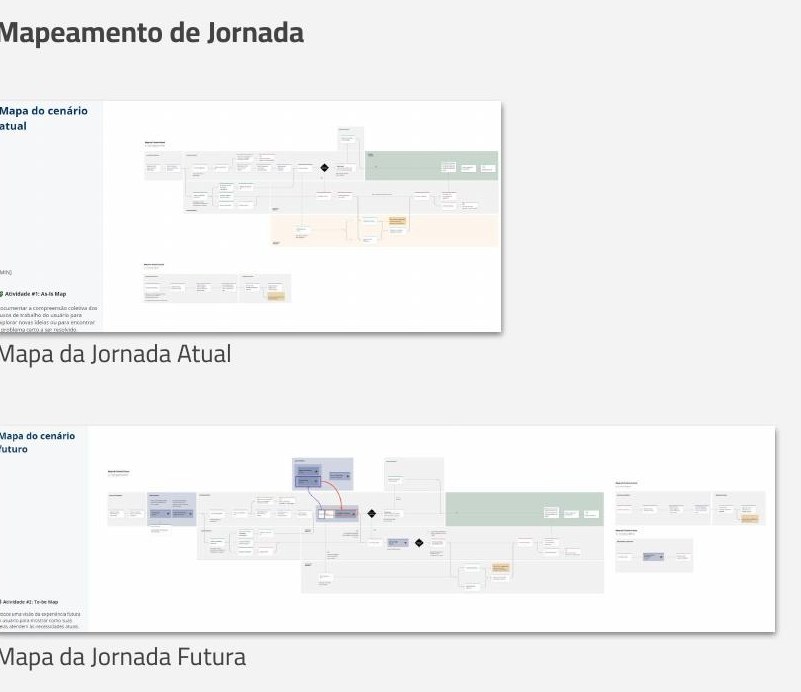
Journey mapping — current and future scenarios - 02
Mapping the ecosystem: metrics, variables and rules
I mapped the operational journey to spot bottlenecks, set success criteria and isolate the determining variables for the predictive models. This stage defined the system's priority rules and shaped the information architecture of the analytical dashboards.
- Solution A — Fraud and deviation score
- Solution B — Provider analysis
- Solution C — Image intelligence
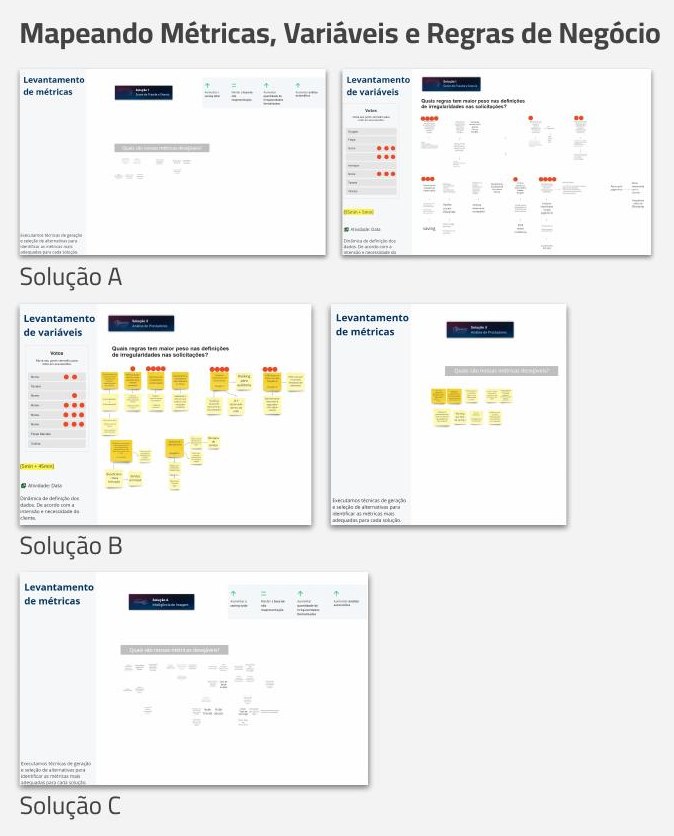
Mapping metrics, variables and business rules (Solutions A, B and C) - 03
Data prioritisation: effort × impact
Each candidate indicator was assessed with data engineers and scientists for development effort and business impact, producing a defensible analytical backlog — from ranking offending providers to detecting premature claims from newly accredited providers.
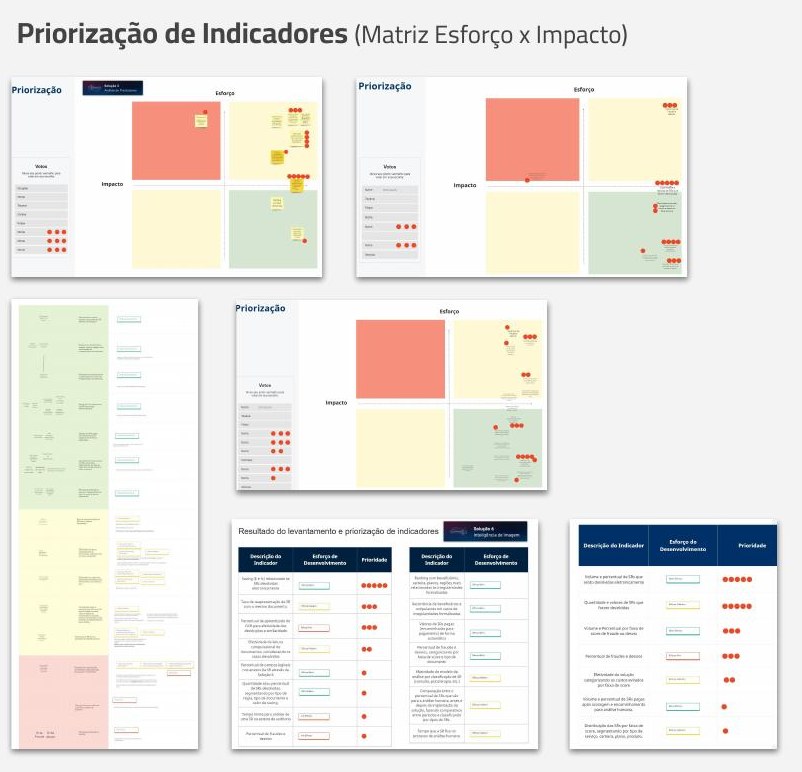
Indicator prioritisation — effort × impact matrix - 04
Strategic scope: user stories and data mapping
I translated the prioritised indicators into user stories connected to available data sources, making sure every screen came from a real business decision and from data that could actually be collected.
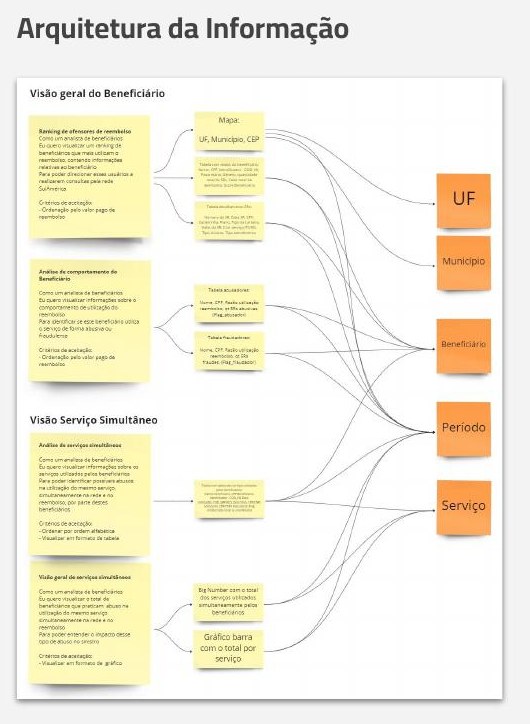
Information architecture of the analytical dashboards - 05
Low and high-fidelity prototypes
I built the claim analysis flow and the monitoring dashboards: member view, provider view, geographic ranking maps and cuts by period, service and portfolio.
- Reimbursement claim analysis flow
- Member intelligence dashboard
- Provider intelligence dashboard
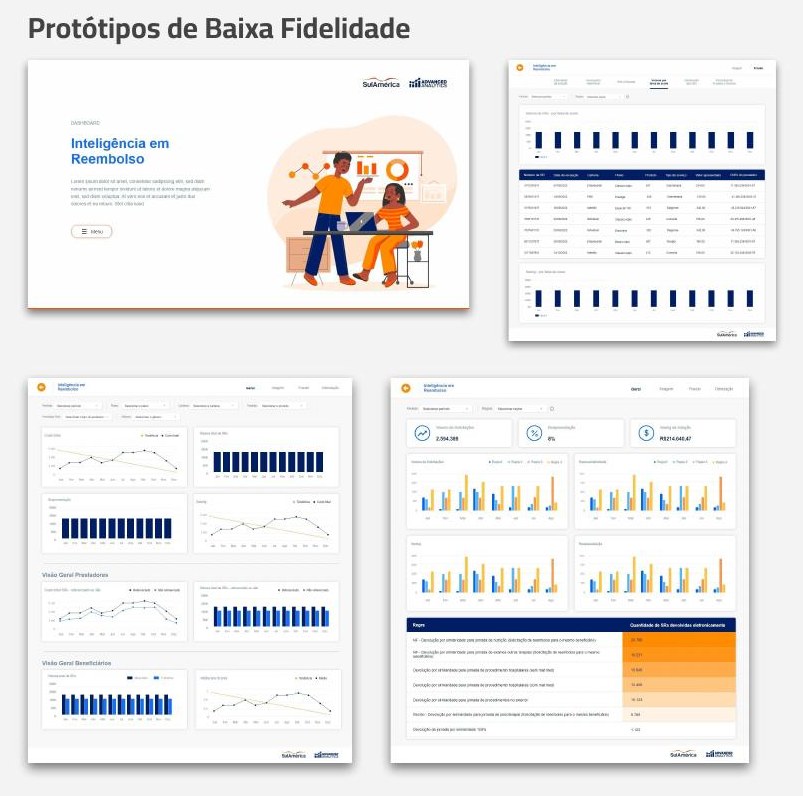
Low-fidelity prototypes 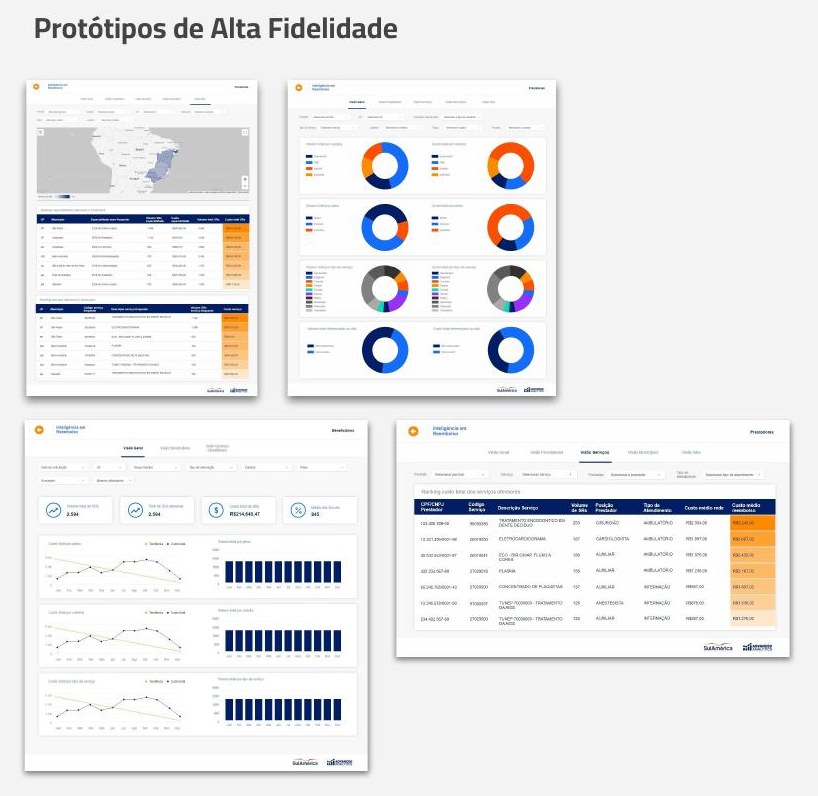
High-fidelity prototypes - 06
Engineering handoff and evaluative research
Usability testing with the insurer's analysts guided dashboard refinement. A structured handoff with the engineering team kept the shipped product faithful to the design.
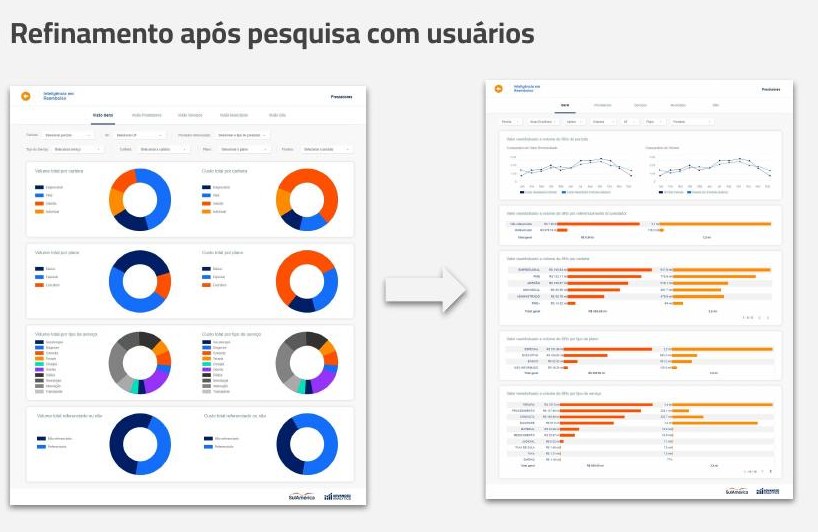
Refinement after user research — data visualisations 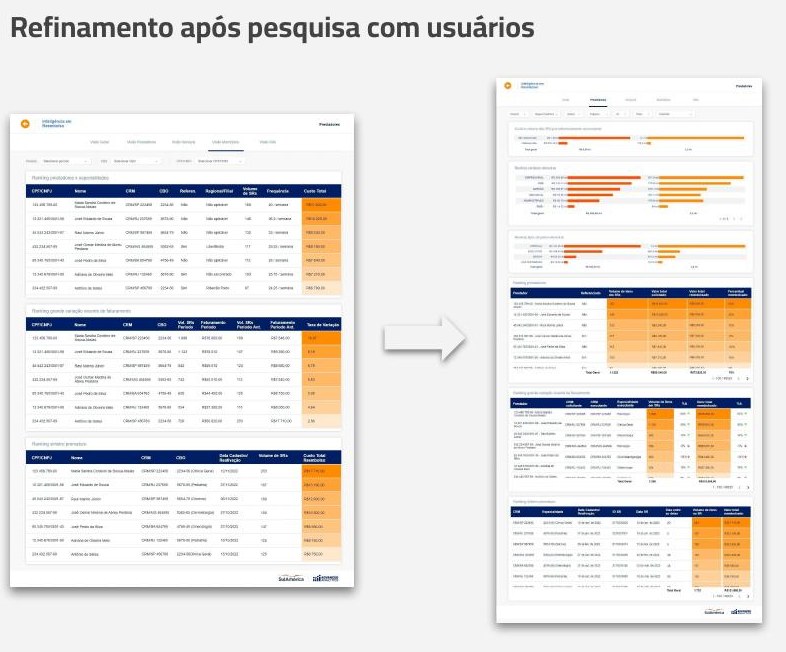
Refinement after user research — analysis tables
Impact
Just 6 months after launch, the intelligent triage ecosystem sharply reduced false positives and generated R$ 30 million in direct savings for SulAmérica, expanding the team's analytical capacity and setting a new standard for data-driven risk management.
Discuss a similar challenge